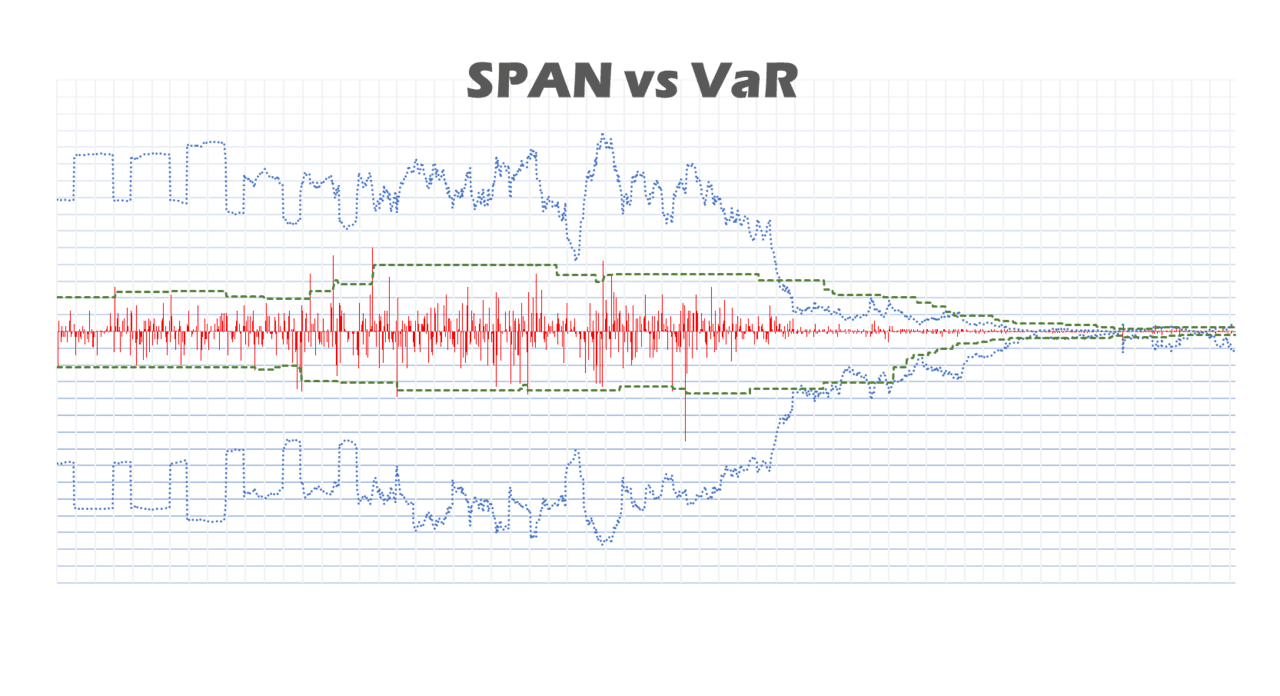
A validation of SPAN in times of market stress and how the margin requirement of a CME Eurodollar option spiked by 510% in just one day
Derivatives users are probably aware of the Standard Portfolio Analysis of Risk (SPAN) method used by most CCPs globally. Many would say that an update to the decades-old SPAN methodology is long overdue. For this reason, CCPs are gradually shifting from SPAN to VaR-based methodologies for margin calculation.
For example, Eurex Clearing from December 2017 is margining all products with the VaR-based margin calculator, Prisma. CME is expected to roll out a new margin calculator that will ditch the current SPAN algorithm in favour of a VaR-based approach. Since 2013, ICE has attempted to adopt a new VaR-based margin system, known as the Multi-Asset-Portfolio-Simulation (MAPS) – this project is still running under a different name.
It is not surprising that whole industry is going to move away from SPAN and adopt VaR-based methodologies. However, CCPs wishing to implement new margin calculators are now facing stricter rules forcing them to incorporate additional liquidity margin charges; and, if we account for the operational complexity of implementing a new margin calculator, then we can expect the SPAN methodology to remain an industry standard over the next five and, possibly, ten years.
SPAN assesses the margin of a derivative as the worst value-loss of 16 different price and volatility scenarios. Under this approach, we would only expect jumps in margin requirements either as the future tier structure rolls over on expiry, or as the SPAN parameters are updated (both events easily predictable). Nevertheless, unpredictable spikes are common on options.
Obviously, there is enough to explain about SPAN to cover an entire textbook, but for brevity, I have chosen to illustrate here the margin calculation of SPAN on a CME Eurodollar option in a day of market turbulence and compare the results against the historical Value-at-Risk (VaR).
On Tuesday, 29th May 2018, bond yields plummeted as the Italian political turmoil sent shockwaves through global markets. Rates rebounded the day after as investors deemed the market reaction overwrought. The spike in implied volatility and change in underlying prices caused an increase in margin requirement out of proportion for some CME Eurodollar options.
From the SPAN Risk Parameter files, is possible to extract implied volatilities and prices to perform a VaR calculation. So, I have performed a historical 250 days 99% VaR calculation on a short 99 Call June-19 CME Eurodollar and compared the results against the corresponding SPAN maintenance margin (a step-by-step validation is provided at the end of this article). The results summarised in chart 1, show that on May 29th, the call option generated a loss of USD 22 causing a margin breach. The SPAN maintenance margin covered only 46% of the loss, and the 250d VaR would have given similar coverage at that point.
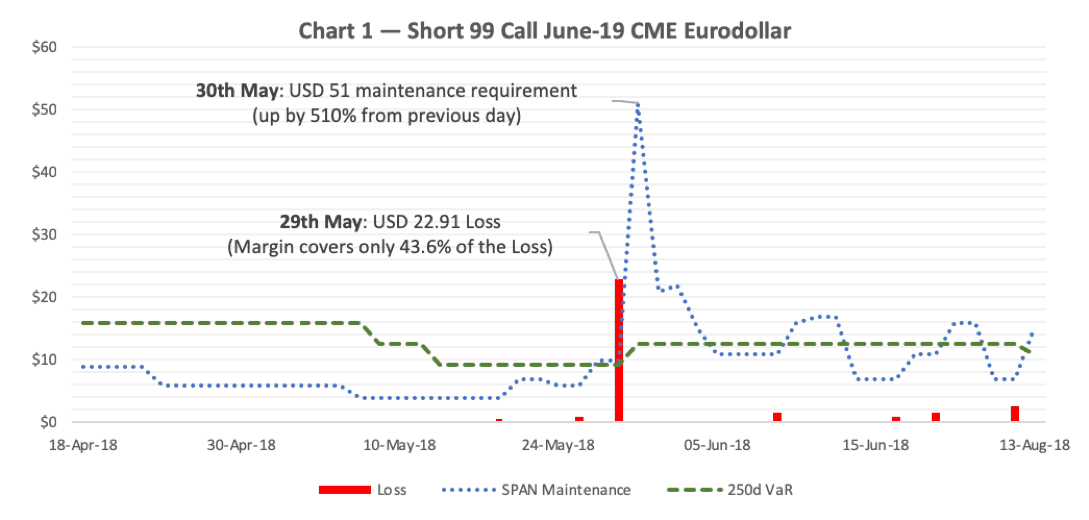
In the morning of May 30th, the materialised loss was not the only thing that surprised some market participants. Another element of surprise was the 510% increase in margin requirement, that combined to the loss, generated substantial margin calls. It is worth mentioning that, in contrast, the VaR increased by a reasonable amount to account for the higher volatility.
SPAN drastically fails when it comes to margining options as the methodology does not account for changes in implied volatility over time. This failure happens because CCPs using SPAN set a unique volatility scanning range for all strikes available within an expiry, and update this rarely. CCPs could theoretically solve this problem by assigning a different volatility scanning range on each strike within an expiry, and update this on a daily basis. In practice, this would imply a huge operational burden for CCPs.
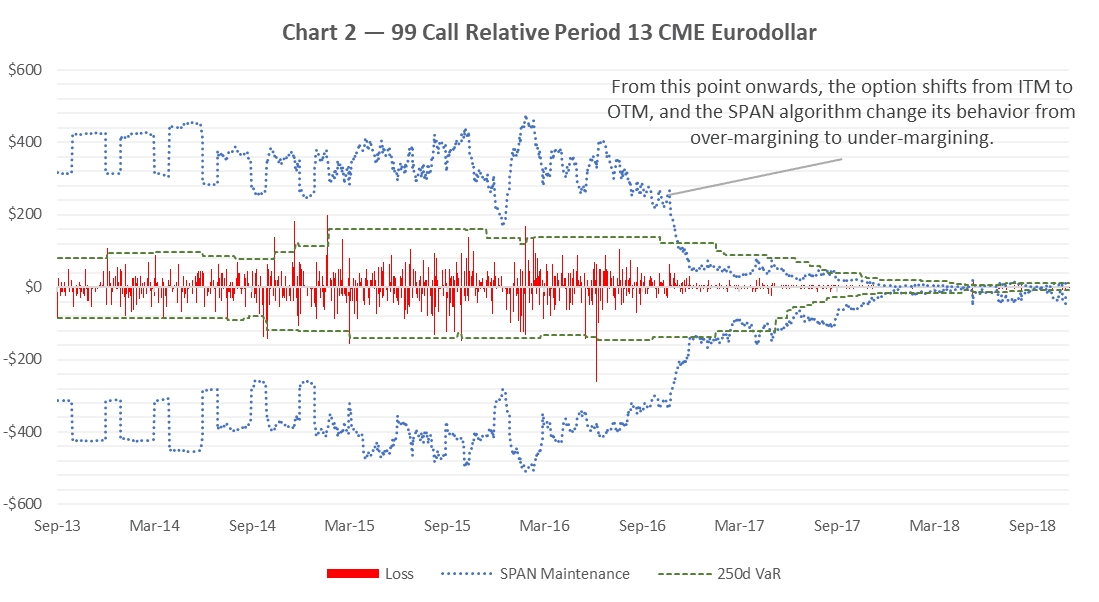
SPAN is under-margining out-the-money (OTM) options and over-margining in-the-money (ITM) options. Furthermore, when markets are quiet, and the implied volatility is sinking, the under-margining nature of SPAN on OTM options create the potential of huge margin spikes. This behaviour is showed in chart 2; the chart displays the VaR and SPAN maintenance of a 99 Call Relative-Period-13 CME Eurodollar, for the last 5 years going back to 2013.
Step-by-step illustration of the SPAN algorithm
In what follows, I validate the SPAN maintenance margin of a short 99 Call Jun-19 Eurodollar in the period between the 29th and 30th of May 2018.
The 16 SPAN risk scenarios are all different combinations of movements in price and implied volatility, as described in the following table:
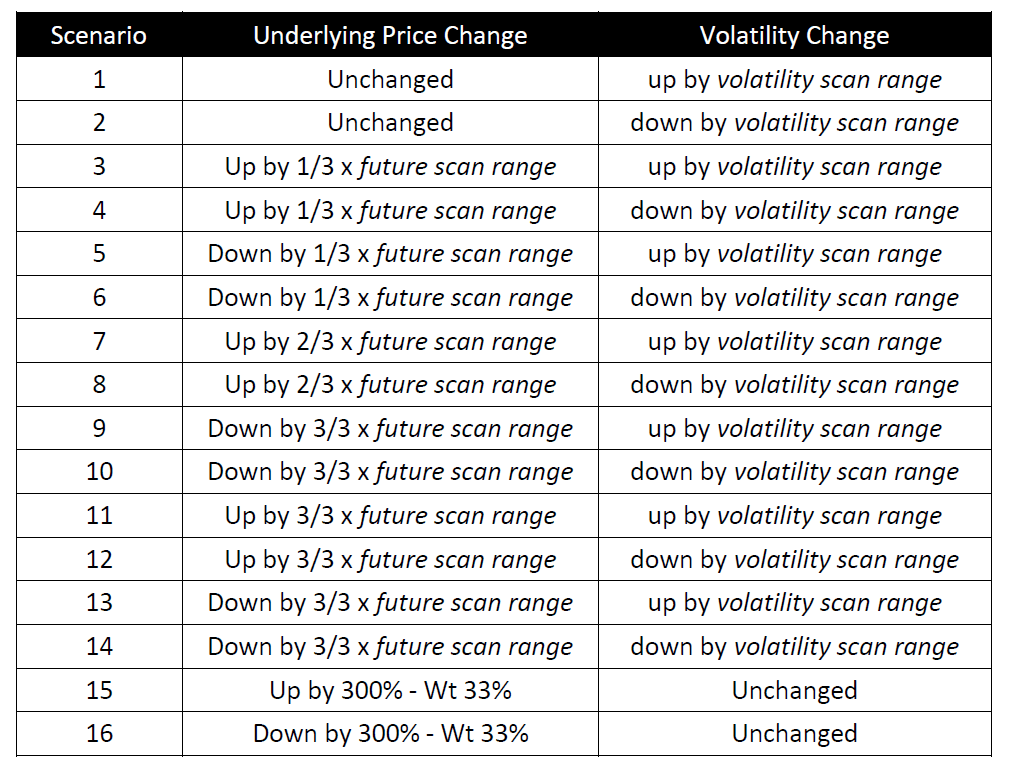
So, for example, the value-loss of the SPAN scenario 11 on an option can be computed with the following formula:

Where:
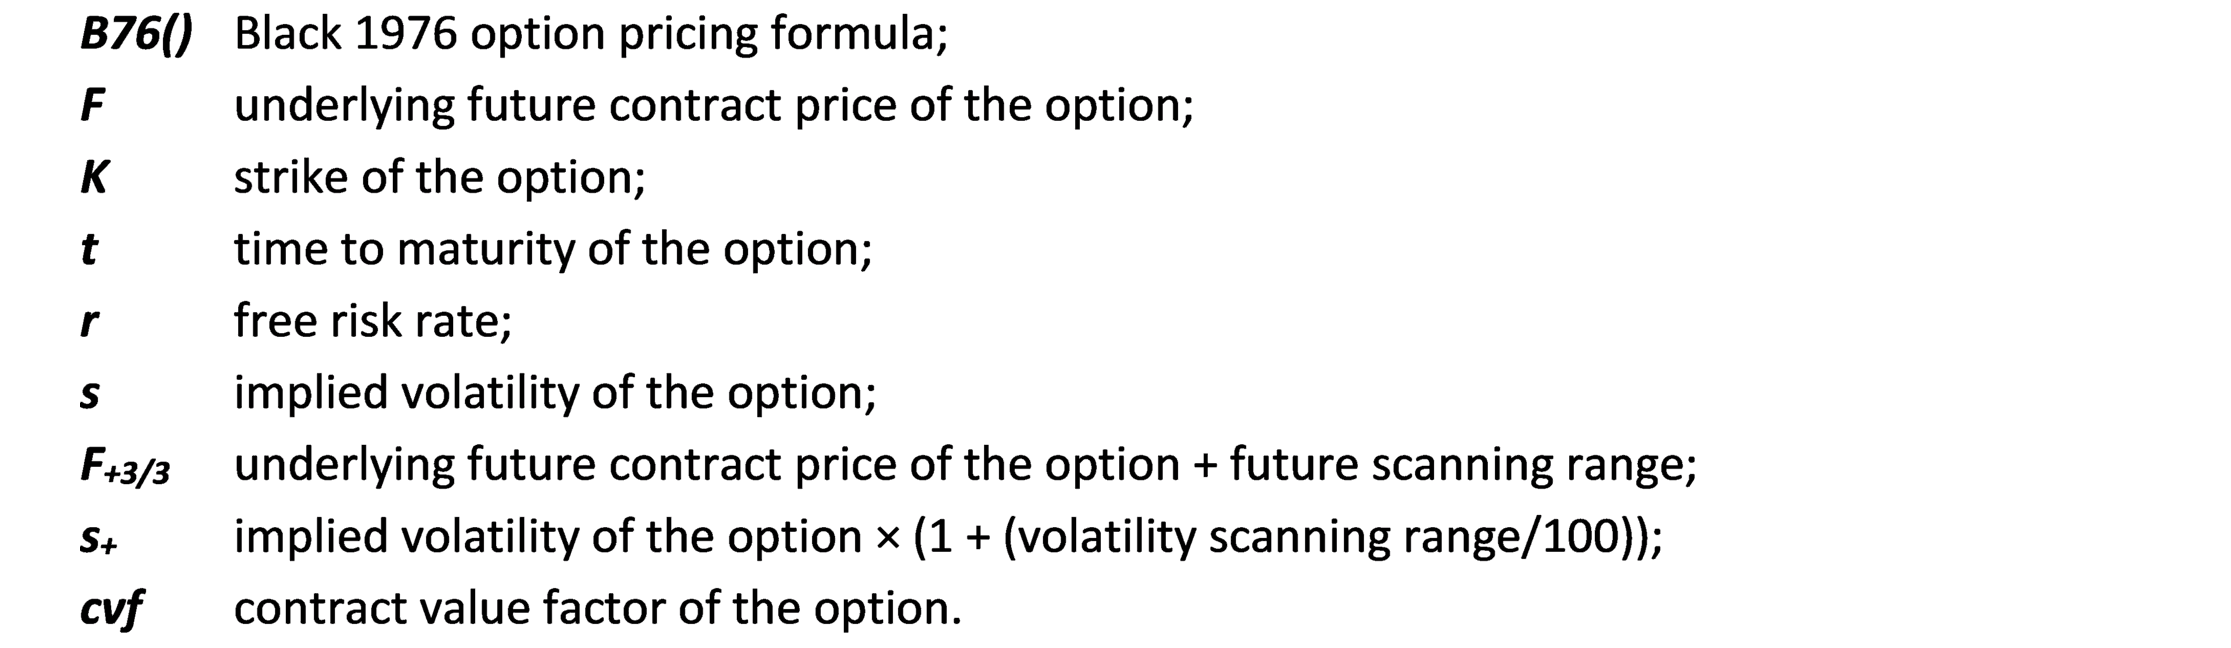
The parameters required to calculate the maintenance margin of a 99 Call Jun-19 Eurodollar, between the 29th and 30th of May 2018 are contained in the SPAN Risk Parameter files and reported here:
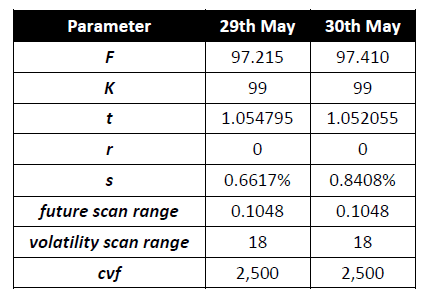
Note that CCPs produce the SPAN Risk Parameter files as part of the end-of-day (EOD) clearing processing. Therefore, EOD market statistics are used for the margining of position in T+1; i.e. settlement prices of T+0 are used for the margin calculation on T+1.
With the above formula and parameters, we can compute the 16 SPAN scenarios for a 99 Call Jun-19 Eurodollar on the two different days as follows:
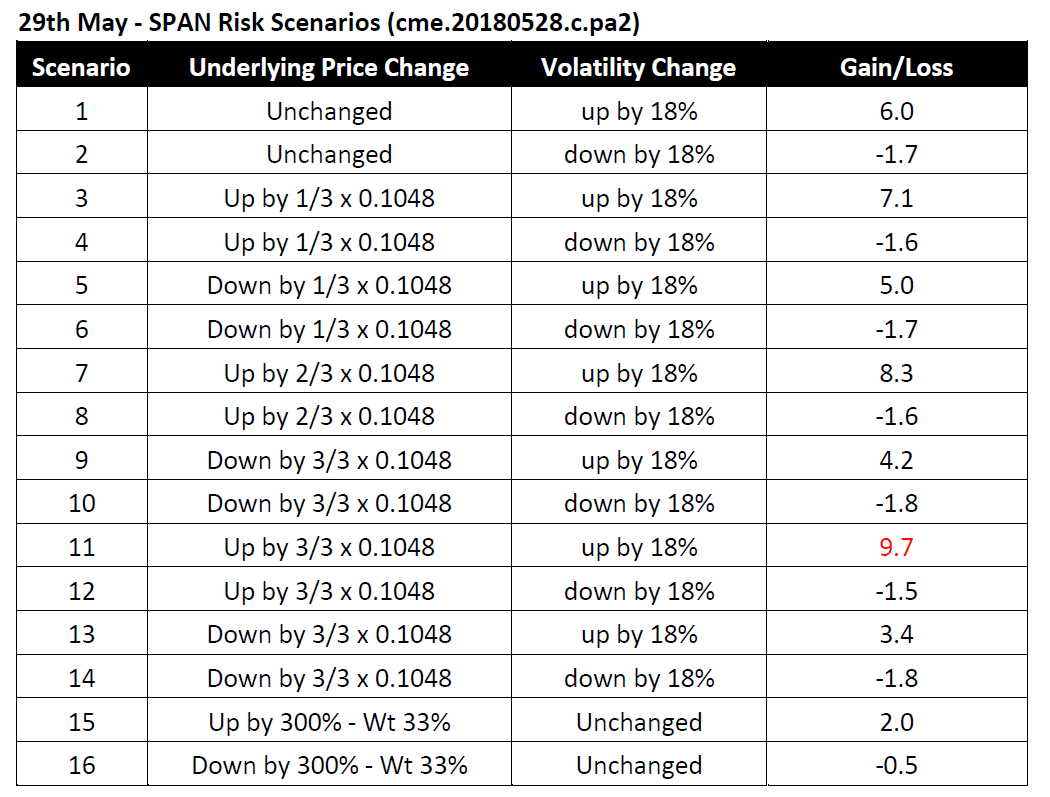
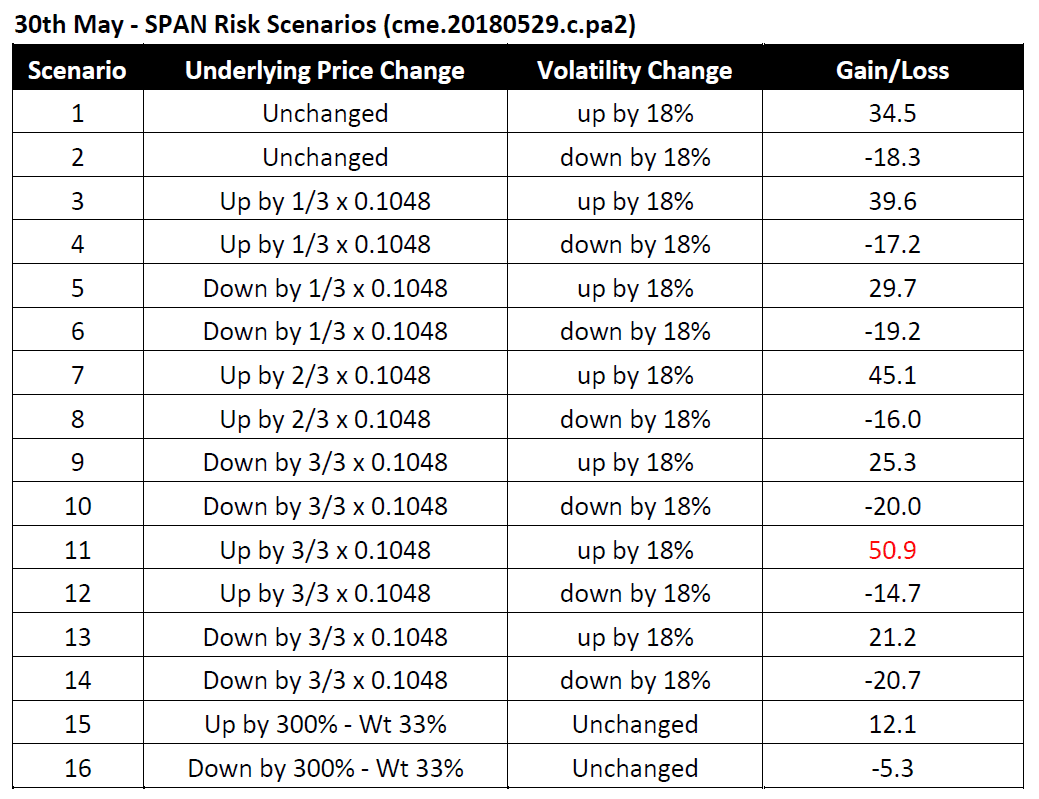
The worst value-loss scenarios are highlighted in red within the above tables. We conclude that on 29th May 2018, the SPAN maintenance margin of a short 99 Call Jun-19 Eurodollar was USD 10 and increased by 510% to USD 51 on the following day.
Get in touch to find out more about Cumulus9.